Computing the Distance Between DNA Sequences - Not As Simple As You Might Think
Scientists and doctors have been studying genes and hereditary conditions (those handed down from parent to child) for many years. These days, it is possible for someone to have a genetic test for several illnesses. A blood sample is taken and closely examined for abnormal chromosomes, but because so much information is stored on the DNA, scientists only tend to look for particular disorders. This process is now available thanks to a field known as Genomic Medicine.
Intuitively, genomic medicine is the study of genes (DNA) and their interaction with the medical state of a patient. Genomics investigates how a person's biological information can be used to perform a more effective diagnosis and provide personalized treatment. For instance, genomic data is used where the cause of a range of symptoms cannot be pinpointed by any other means. Another case is where there is a family history of serious genetic disorders, it can tell prospective parents whether or not they are a carrier and if they can pass it on to their children. In a similar manner, it can also tell someone if they are likely to develop the inherited condition later in life, even if they do not yet have any symptoms.
The underline research that allows genomic medicine to prosper is Bioinformatic. According to the National Human Genome Research Institute, Bioinformatics is a subdiscipline of biology and computer science concerned with the acquisition, storage, analysis, and dissemination of biological data, most often DNA and amino acid sequences. Bioinformatics uses computer programs for a variety of applications, including determining gene and protein functions, establishing evolutionary relationships, and predicting the three-dimensional shapes of proteins; to name a few.
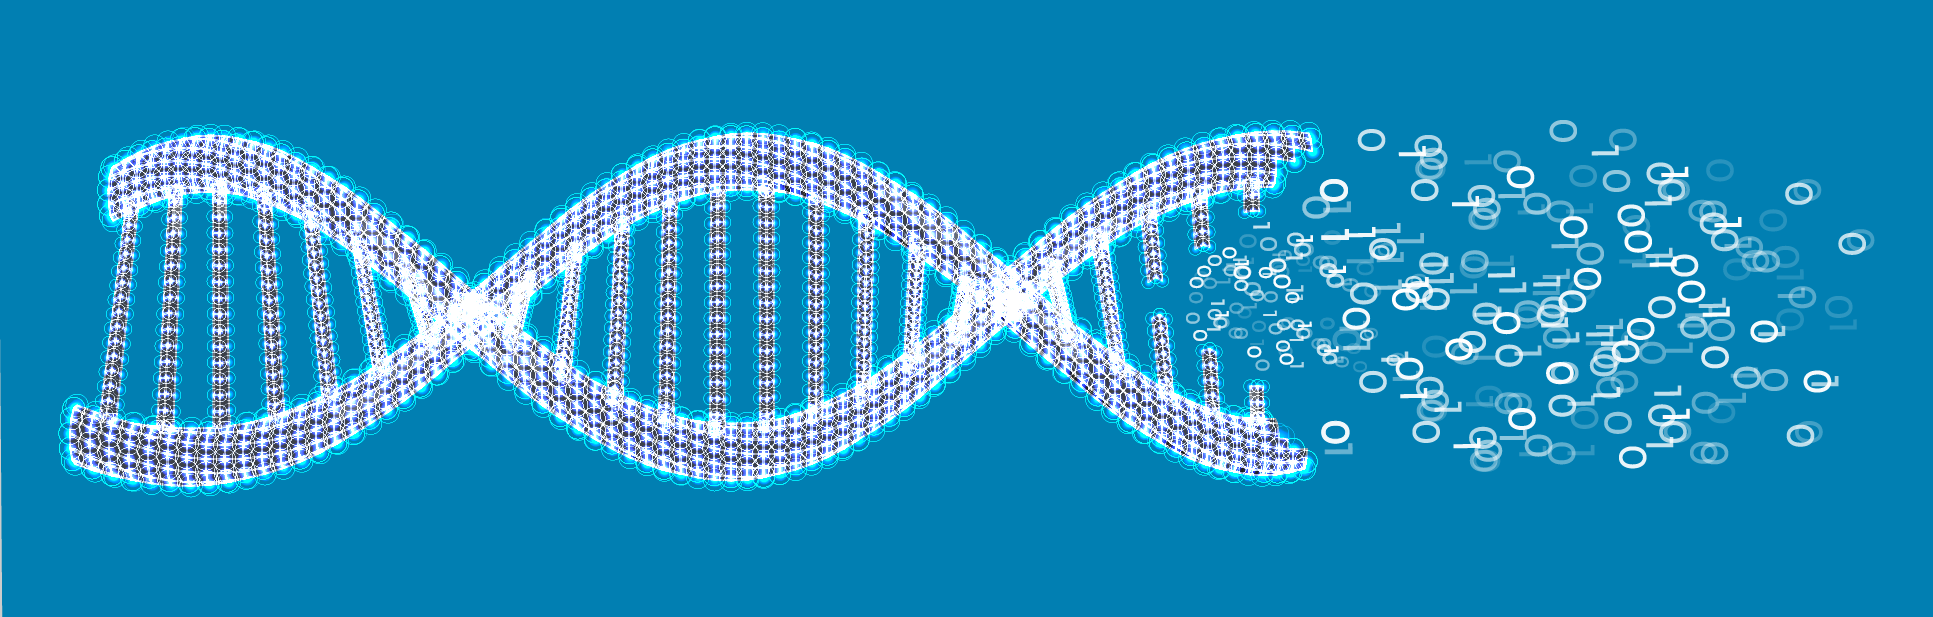
Figure 1. An ilustration of moving from DNA data into digital data.
The main tools of a bioinformatician are computer software programs and the internet. A fundamental activity is sequence analysis of DNA and proteins using various programs and databases available on the world wide web. Anyone, from clinicians to molecular biologists, with access to the internet and relevant websites, can now (usually) freely discover the composition of biological molecules using bioinformatic tools. This does not imply that handling and analysis of raw genomic data can easily be carried out by all. Bioinformatics is an evolving discipline, and expert bioinformaticians now use complex computer science and mathematics for retrieving, sorting out, analyzing, predicting, and storing DNA (and protein) sequence data.
For example, Ardeshir Bayat suggested in his paper from 2002 that "Large commercial enterprises such as pharmaceutical companies employ bioinformaticians to perform and maintain the large scale and complicated bioinformatics needs of these industries. With an ever-increasing need for constant input from bioinformatics experts, most biomedical laboratories may soon have their own in-house bioinformatician. The individual researcher, beyond a basic acquisition and analysis of simple data, would certainly need external bioinformatic advice for any complex analysis." [6].
At the same time, the amount of genomic data is increasing over the years as the price for a single DNA sequencing is dropping as shown in figure 2. This reduction in costs is associated with the development of new technology such as single-molecule sequencing [2] and next-generation sequencing [3]. Therefore, a trend in which research in the genomic sciences is confronted with the volume of sequencing and resequencing data increasing at a higher pace than that of data storage and communication resources, shifting a significant part of research budgets from the sequencing component of a project to the computational one [4].
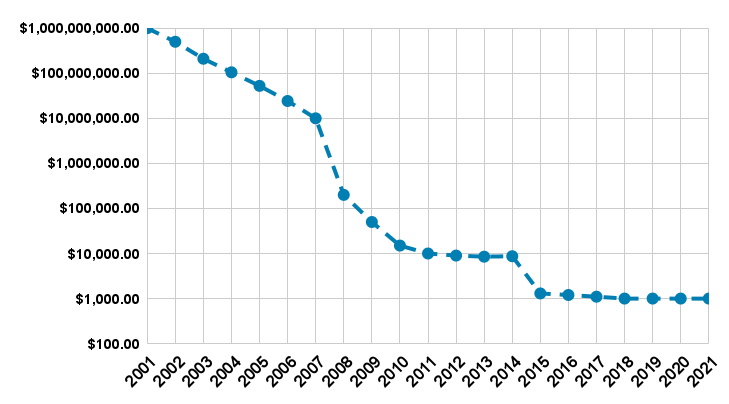
Figure 2. The data was obtained from the NHGRI Genome Sequencing Program (GSP), by Kris A. Wetterstrand. The values are referred to sanger-based sequencing (average read length of 500-600 bases) with 6-fold coverage for the first decade while the latter is referred to Illumina and SOLiD sequencing (average read length of 75-150 bases) with 30-fold coverage. Note, the graph is schematic, please refer to this website for more detailed values.
Indeed, large-scale projects such as the Cancer Genome Atlas and One Thousand Genomes Project were established and more projects emerge by the day. On top of that, we would probably see cheaper, faster, less prone to errors, and higher-throughput sequencing methodologies which will be paving the way to individual genomics and personalized medicine thanks to the prizes various organizations offering in the last few years such as this one [5].
It is fair to claim that after two decades, Bioinformatic today contains a wide range of computational and mathematical tasks, algorithms, and analysis methods to extract knowledge about biological systems and allow us to exploit current our biological and clinical understanding to further push the limit of our modeling and prediction abilities. In particular, the evaluation of the similarity between two (or more) DNA sequences since it is a common and central step in multiple DNA sequence analysis. Therefore, this is the main concern of this post. Indeed, it has attracted much research effort over the years, and many algorithms and tools have been developed to tackle this task [6].
In order to convince the critical reader that the task of finding/developing a well-defined similarity metric between two DNA sequences which are also can be officially computed is important, one can take a look at the following incomplete list of bioinformatic tasks that require this procedure:
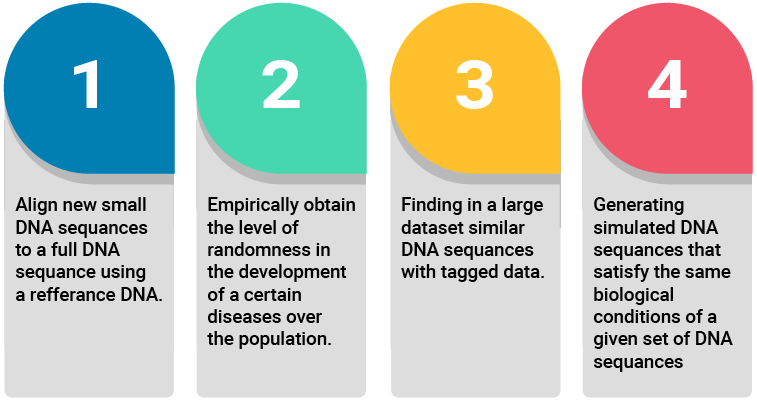
Figure 3. A bioinformatic tasks that require computing the similarity between DNA sequences.
It is possible to divide the DNA sequence comparison into two main groups: direct and representative comparisons. The direct comparison group contains algorithms that use the whole or portions of the original DNA sequence. On the other hand, the representative comparison group contains algorithms that use an aggregated format of the DNA sequence, usually by mapping the sequence to some small representation space. In the following sections, several leading candidates from each group are described with its strength and limitations.
Direct comparison algorithms
BLAST
Created by a group at the U.S. National Center for Biotechnology Information around 1990, the Basic Local Alignment Search Tool (BLAST) is arguably the most commonly used tool for sequence analysis (which is available for free at least). While there are multiple implementations for BLAST that researchers proposed over the year, the main idea is to compute the similarity between two or more distributions of DNA properties. In particular, the most spread version of BLAST works by detecting local alignments between short sequences. This process involves extracting a small set of letters that usually represent some biological element (for instance, the nucleotides ATC). Afterward, the BLAST algorithm computes the number of times the sub-sequence appear and their corosponding places along the sequence. This defines one distribution (signature) of each DNA sequence. A useful extension is by looking at the distribution signature of closely related sets of letters (continuing the last example, the nucleotides ATT is similar to ATC). Then, the similarity between two DNA sequences is the similarity between the n-dimensional distribution of all the sub-sequences used in the comparison.
The BLAST algorithm is providing wonderful results in general but falls short in too narrow or wide comparison as the algorithm is very sensitive to what sub-sequences are used and how many of them have been used. A possible explanation for this phenomenon is that the algorithms are making estimates of the best possible alignments, you may have errors pop up due to rare single-nucleotide polymorphism (SNPs).
SSearch
SSearch uses William Pearson's implementation of the method of Smith and Waterman to search for similarities between one sequence and any group of sequences. This method uses a scoring matrix (containing match/mismatch scores), a gap creation penalty, and a gap extension penalty as scoring criteria to determine the best region of local similarity between a pair of sequences. This score is reported as the Smith-Waterman score. Basically, after the Smith-Waterman score for a pairwise alignment is determined, the algorithm uses a simple linear regression against the natural log of the search set sequence length to calculate a normalized z-score for the sequence pair [7]. The distribution of the z-scores tends to closely approximate an extreme-value distribution. Based on this distribution, the algorithm can estimate the number of sequences that would be expected to produce, stochastically, a z-score greater than or equal to the z-score obtained in the search. One limitation of the SSearch algorithm is that for the estimates of statistical significance to be valid, the search set must contain a large sample of unrelated sequences.
FASTA
The first step in the search is to locate regions of the query sequence and the search set sequence that have high densities of exact sub-sequence matches. The algorithm for this step of the search is a modification of the algorithm of Wilbur and Lipman [8] and may be referred to as a hash-table lookup search or hashing. Specifically, this search method is a "direct addressing" or "k-tuple preprocessing" method which increases the speed of the search at the expense of some sensitivity.
Formally, the hashing process works as follows. After one gives the algorithm a length for the sub-sequence, it makes up a dictionary of all of the possible words of that size in the query sequence. A second dictionary is created for the opposite strand if the query is a nucleic acid sequence. Each sub-sequence is converted to a unique base-4 number (as the number of possible letters) that serves as an index to the corresponding dictionary entry. Each entry contains a list of numbers telling the location of the sub-sequence in the query sequence. If the word does not occur, the entry contains only the number zero.
Formally, the hashing process works as follows. After one gives the algorithm a length for the sub-sequence, it makes up a dictionary of all of the possible words of that size in the query sequence. A second dictionary is created for the opposite strand if the query is a nucleic acid sequence. Each sub-sequence is converted to a unique base-4 number (as the number of possible letters) that serves as an index to the corresponding dictionary entry. Each entry contains a list of numbers telling the location of the sub-sequence in the query sequence. If the word does not occur, the entry contains only the number zero. It is important to realize that the hashing process cannot deal with ambiguity!
Afterward, the X highest-scoring regions for the sequence pair (the regions with the highest density of exact sub-sequence matches) are re-scored using a scoring matrix that allows conservative replacements. The ends of each region are trimmed to include only those residues that contribute to the highest score for the region, resulting in X partial alignments without gaps. These are referred to as the initial regions. The score of the highest-scoring initial region is saved for later use. Next, the algorithm determines if any of the initial regions from different diagonals may be joined together to form an approximate alignment with gaps. Only non-overlapping regions may be joined and the score for the joined regions is the sum of the scores of the initial regions minus a joining penalty for each gap. The score of the highest-scoring region at the end of this step is saved.
Then, different versions of the algorithm use some aligning technique such as the Smith-Waterman algorithm commonly used in the SSearch algorithm, as well. When all of the search set sequences have been compared to the query sequence, the list of best scores is obtained.
Similar to the SSearch algorithm, the FASTA algorithm is sensitive to the given size of the sub-sequence and more often than not uses the maximum allowable sub-sequence size to maximize the speed of the search while increasing the algorithm's sensitivity. In some situations, resulting in a search not being sensitive enough to find matches to the query sequence.
Representative comparison algorithms
Alignment-free similarly
Driven by the idea that classification (and therefore similarity) over nucleotide bases improves the efficiency when comparing DNA sequences, one can use the word frequency, position, and nucleotide bases classification in calculating the DNA sequence similarity. The integration of these three classes of data together to enrich the feature vector representing a DNA sequence without increasing too much the dimension of this feature vector is shown to be a promising approach.
According to the chemical properties of nucleotide bases, they can be divided into three categories: purine and pyrimidine group, amino and keto group, and weak\strong hydrogen bond group. In terms of a specific category, each nucleotide base is mapped to a group. Therefore, a DNA sequence is mapped to a new alphabet space that is with base 2 rather than the traditional base 4. Due to the small size, one can define multiple location-depended aggregation functions to further reduce the representation complexity of the sub-sequence (following a similar idea to the hashing done by the FASTA algorithm).
It is safe to claim that there are a variety of features extracted from a raw DNA sequence, such as word frequency, classifications of nucleotide bases, position, and so on. Different alignment-free models employ different features to build feature space. There is a trade-off between the feature vector size and the performance of the align-free model. However, it is a fact that the longer feature vector may not guarantee a better clustering result [9].
Data-driven alignment-free feature vector
Following the complexity of obtaining a well-representative feature vector of a DNA sequence and in parallel to the development of the data-driven algorithm, the bioinformatics researcher started to take advantage of the machine learning algorithms to obtain better feature vectors. In particular, first attempts used domain-knowledge with machine learning methods to determinate feature vectors such as the one proposed by Zhou et al. [10] with mathematical descriptor based on the characterization of cis sequence DNA networks. Afterward, pure machine learning and later deep learning methods were used to obtain larger and more accurate feature vectors. For example, Seo et al. [11] introduce DeepFam, an alignment-free method that can extract functional information directly from sequences without the need for multiple sequence alignments. The authors used an Auto-encoder convolutional neural network architecture, encoding the DNA sequence to the neral network using either the Hidden Markov Model (HMM) or k-mer based logistic regression.
Unsurprisingly, these algorithms give better empirical results than expert-based algorithms as happens in so many different disciplines. Nonetheless, the use of these algorithms is only a partial solution as they require a very large amount of information, to train the data-driven models and computing power that is not necessarily accessible to everyone. Hence, making these algorithms promising but hard to understand and expensive to use.
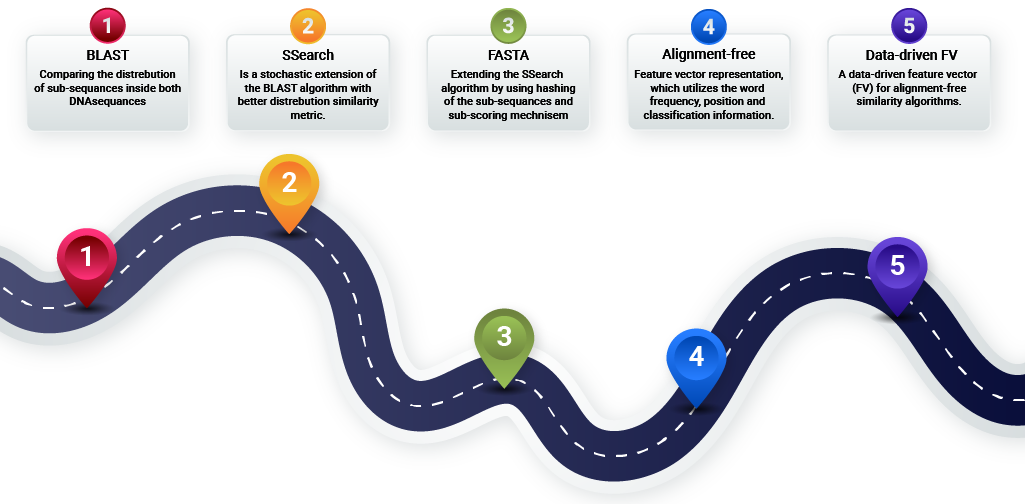
Figure 4. A summary of the evaluation of DNA sequences similarity algorithm.
Conclusion
This review comprehensively introduces the history and characteristics of DNA sequence similarity algorithms. It briefly summarizes the direct and representative algorithms and outlines the advantages and limitations of each one of them. In future research, I believe that the biological field and machine learning will be more closely integrated, and more effective results will be obtained. That said, we should not be purely (and blindly) dependent on computational methods. Therefore, a combination of biological understanding with machine learning methods is a promising approach for future work in the context of DNA sequence similarity metrics.
This review has carried on as part of the OMEGA project where we aim to simulate DNA sequences on demand given a source and target sets of sequences. We, like others, are required to compute the similarity between DNA sequences in our algorithm and therefore review the literature and come up with this summary for bioinformatic newcomers.
References
- A. Bayat. "Bioinformatics". BMJ. 2002; 324:7344, 1018-1022.
- D. Pushkarev, N. F. Neff, S. R. Quake. "Single-molecule sequencing of an individual human genome". Nature Biotechnology. 2009; 27:9, 847-850.
- D. Horner, G. Pavesi, T. Castrignano, P. De Meo, S. Liuni, M. Sammeth, E. Picardi, G. Pesole. "Bioinformatics approaches for genomics and post genomics applications of next-generation sequencing". Briefings in Bioinformatics. 2010; 11:2, 181-197.
- A. J. Pinho, D. Parats, S. P. Garcia. "GReEn: a tool for efficient compression of genome resequencing data". Nucleic Acids Research. 2012; 40:4, e27.
- J. C. Venter. "Multiple personal genomes await". Nature. 2010; 464, 676-677.
- X. Xie, J. Guan, S. Zhou. "Similarity evaluation of DNA sequences based on frequent patterns and entropy". BMC Genomics. 2015; 16, S5.
- W. R. Pearson. "Comparison of methods for searching protein sequence databases". Protein Science. 1995; 4, 1145-1160.
- W. J. Wilbur, D. J. Lipman. "Rapid similarity searches of nucleic acid and protein data banks". PNAS. 1983; 80:3, 726-730.
- J. Bao, R. Yuan, Z. Bao. "An improved alignment-free model for dna sequence similarity metric". BMC Bioinformatic. 2014; 15, 321.
- J. Zhou, P. Zhong, T. Zhang. "A Novel Method for Alignment-free DNA Sequence Similarity Analysis Based on the Characterization of Complex Networks". Evolutionary Bioinformatic. 2016; 12, 229-235.
- S. Seo, M. Oh, Y. Park, S. Kim. "DeepFam: deep learning based alignment-free method for protein family modeling and prediction". Bioinformatic. 2018; 34:13, i254-i262.